What you see when you open it.
These are screenshots of the app, taken from live data. Nothing is mocked up.
The Radar
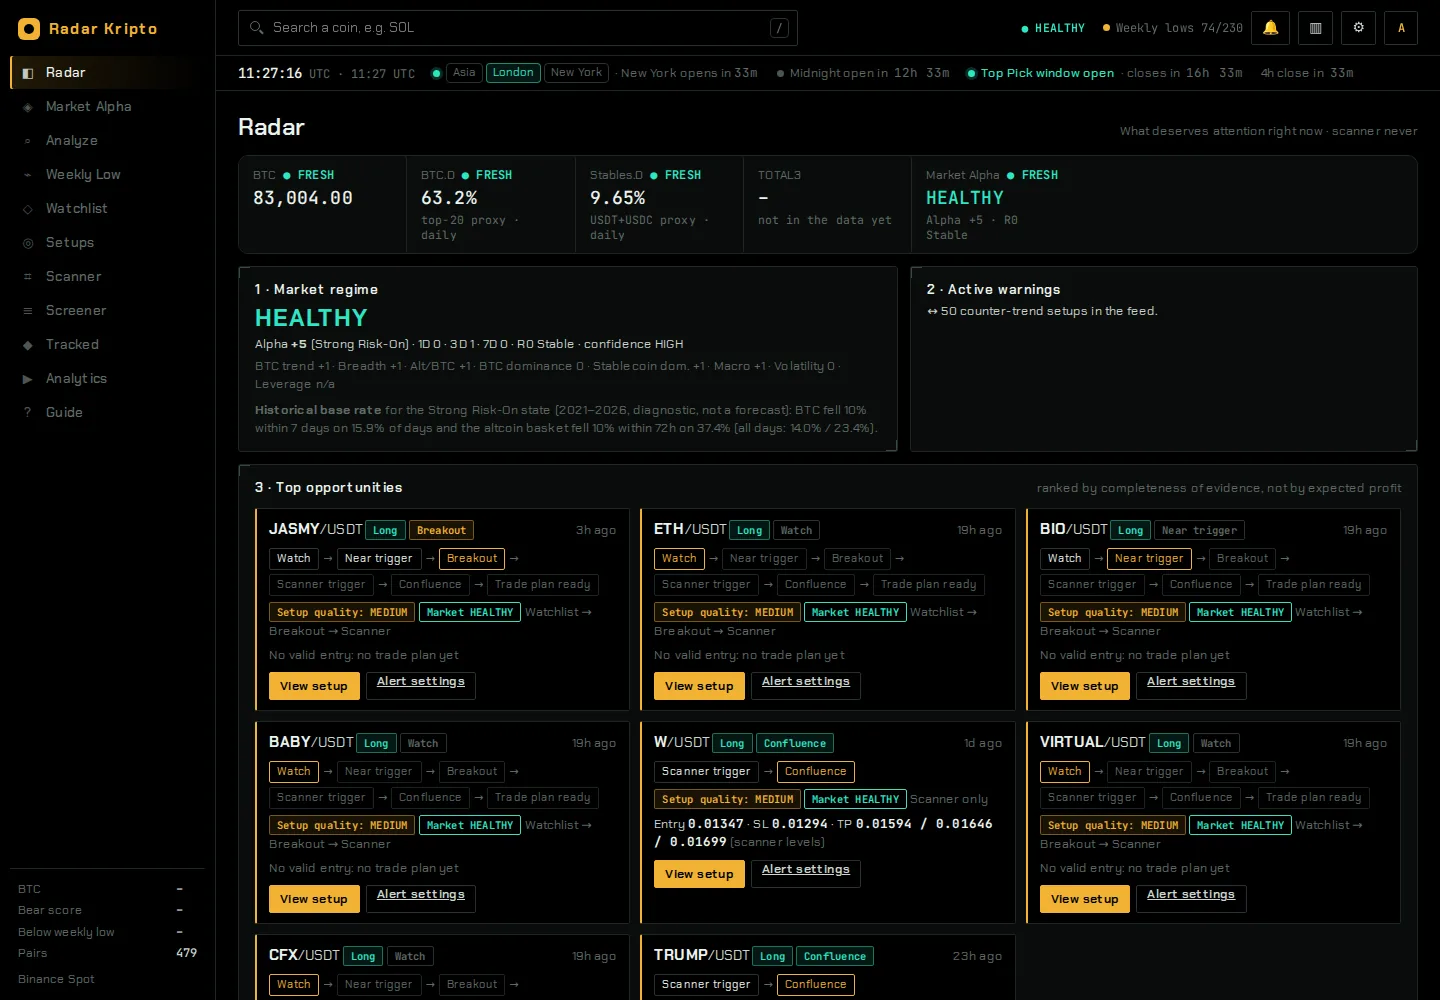
Your first screen answers what deserves attention right now: the market reading at the top, active warnings, then every opportunity with the column it has reached and how long ago it moved.
- Stage for every coin, from watching to trade plan
- Setup quality shown as high, medium or low, from how complete the evidence is
- A movement feed of everything that changed since your last visit
Every setup explains itself
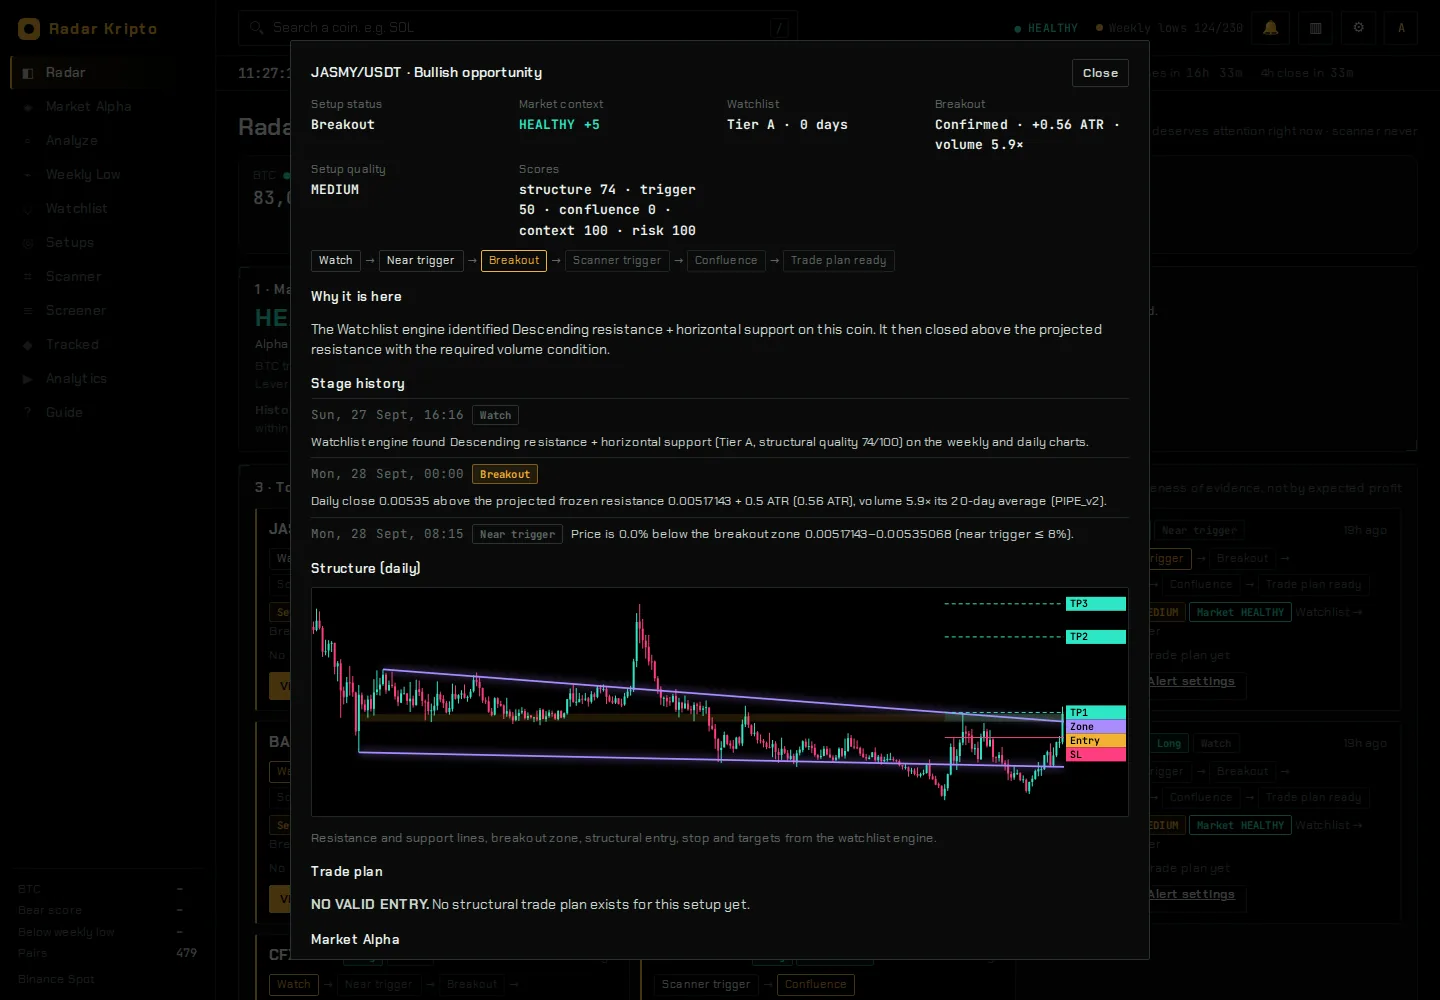
Open any opportunity to see why it is on the board: the structure behind it, the breakout with its size and volume, the scanner signal, and a dated history of every move between columns.
- Daily structure chart with resistance, support, zone, entry and stop
- “No valid entry” when the structure and the setup don't line up
- Each reason taken from the engine's own record, never written after the fact
Market Alpha
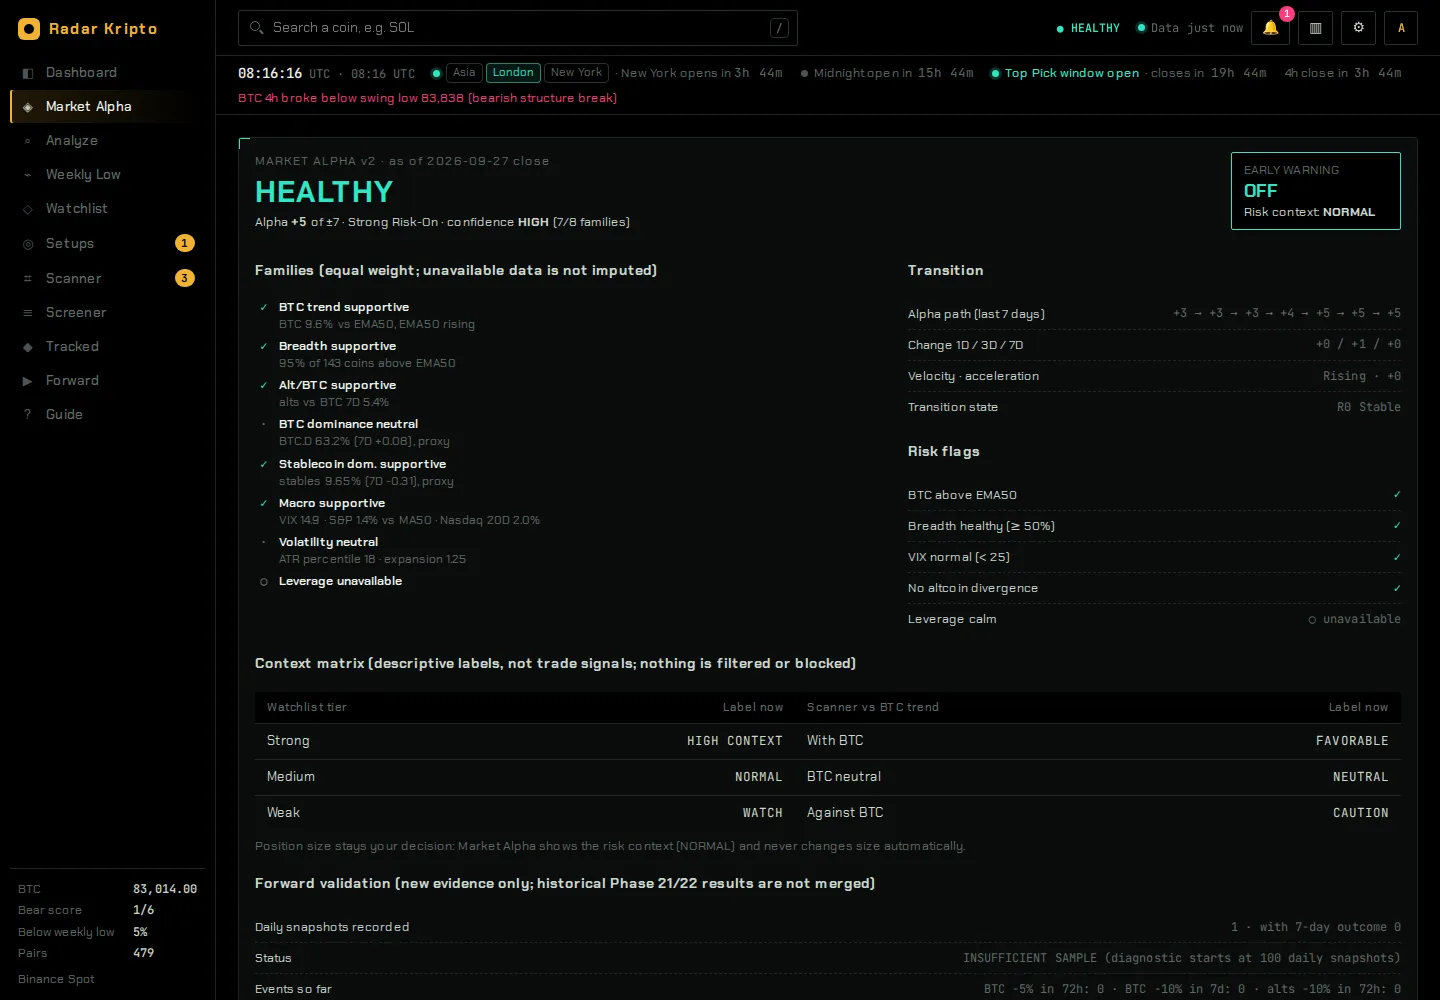
Eight families of market data in one reading, with the change over one, three and seven days. Families that have no current data say “unavailable” instead of counting as neutral.
- Healthy, fragile, risk-off or stress, and whether it is improving
- Early warnings that name the condition that set them off
- Historical base rates, shown as history, never as odds
The signal terminal
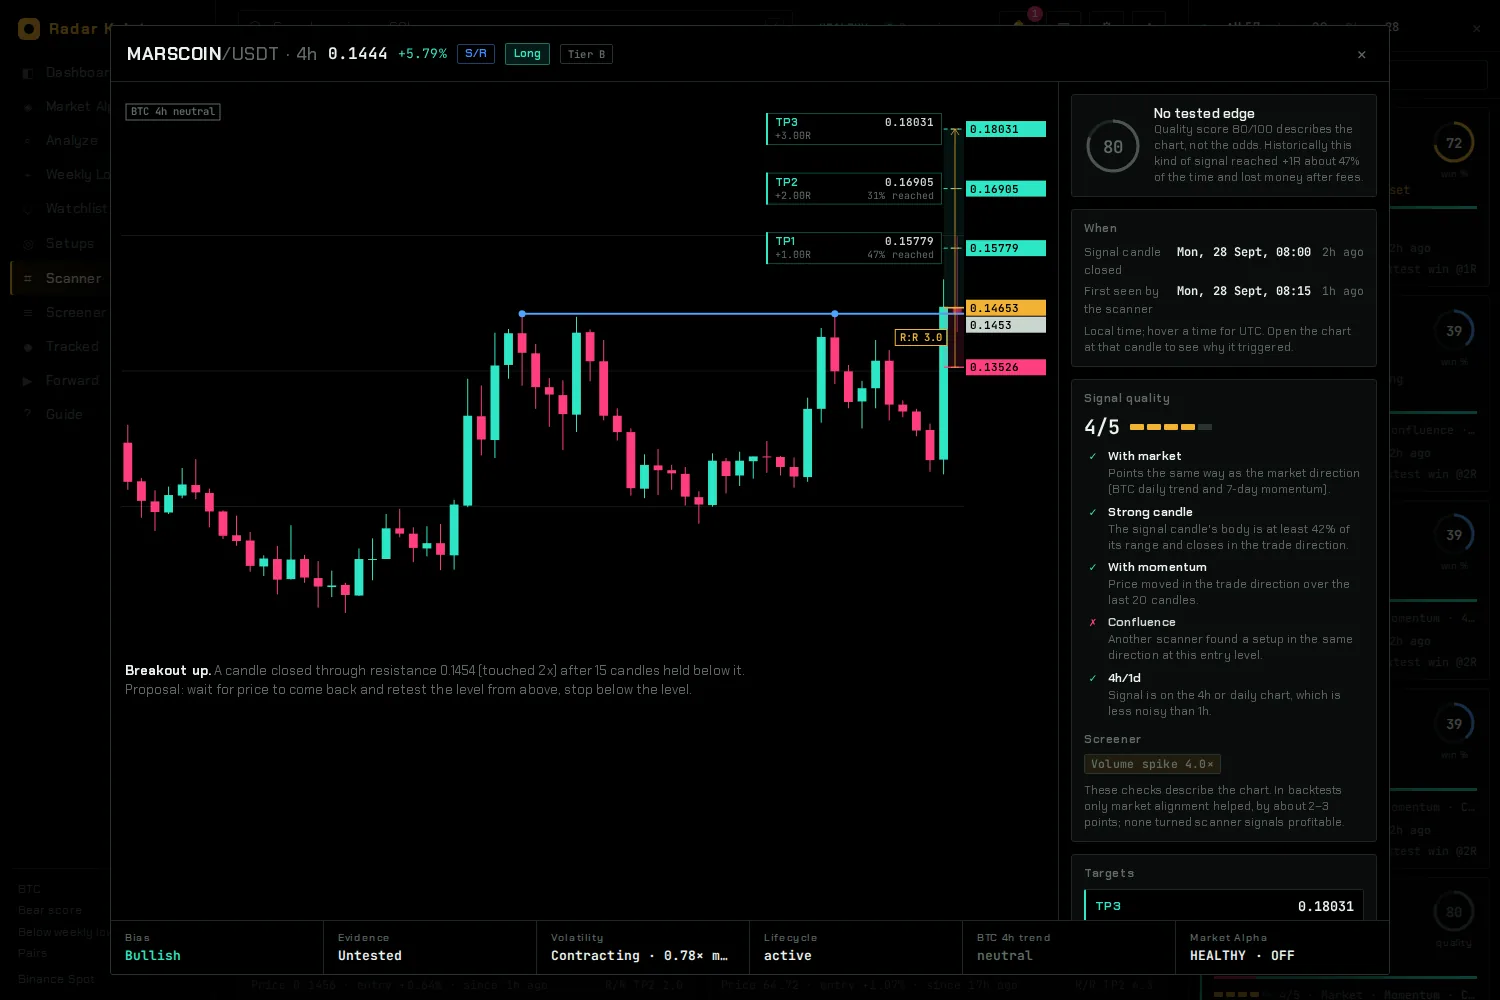
Click any signal for a full chart with its pattern drawn in, the target ladder, the quality checks it passed and failed, and exactly when the signal candle closed.
- Position size and margin for your balance and risk
- Which quality checks passed, with what each one means
- Track a trade and it follows you to every device you sign in on